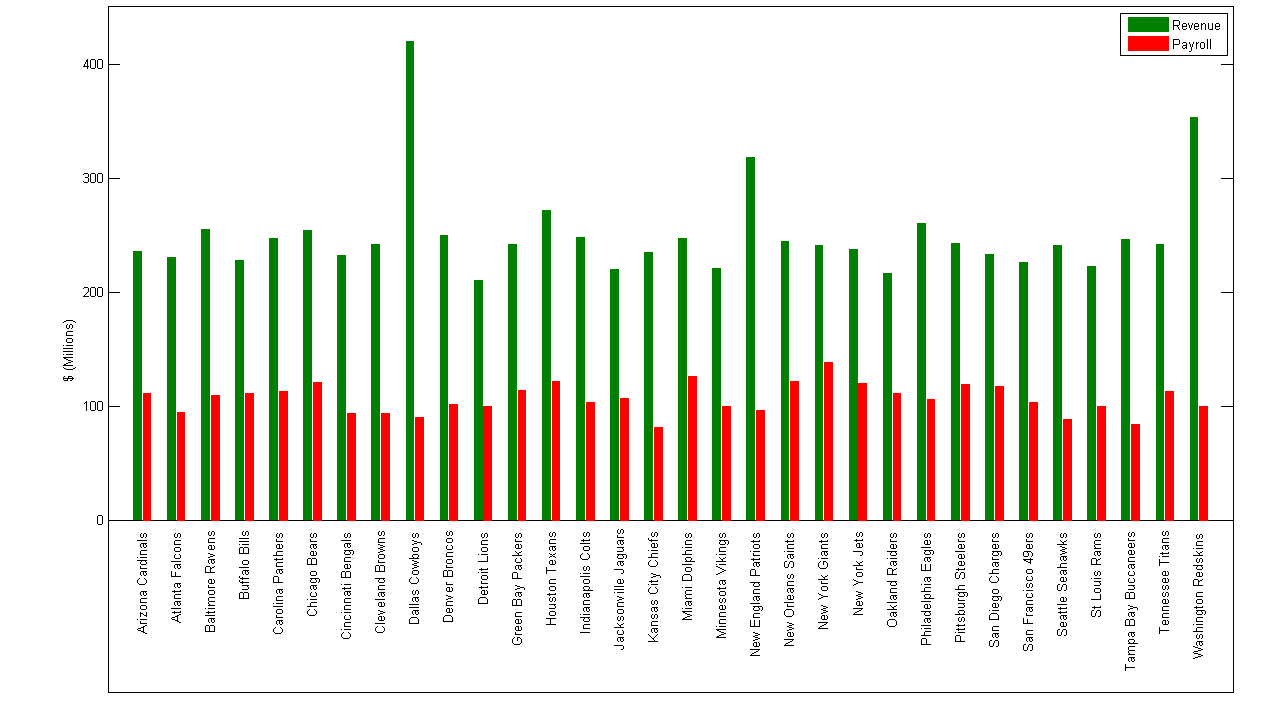
While the NFL just finished its 2011 draft this weekend, it once again is in a lockout, with the owners and players fighting over revenue, season length, health care and other issues. The actual numbers for each of the teams are hard to come by, but thanks to Forbes, we wanted to see what kind of money is being fought over by the 32 owners (as a confession, I am a little biased towards the players).

Continue reading
Category Archives: Sports Analysis
NFL draft – running the 40 and bench pressing
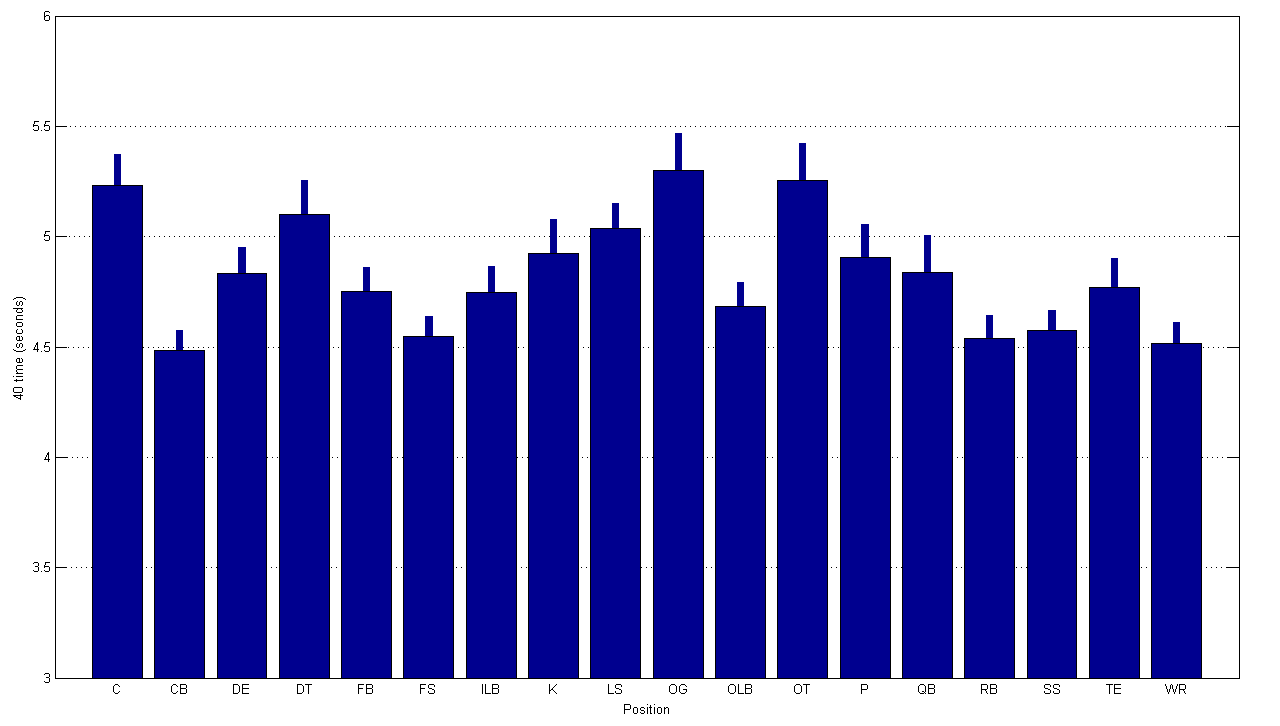
Each year a player’s stock rises tremendously due to performance at the combine (or based on Al Davis’ fancy). While much of a prospects’ mock draft ranking is based on past performance, much is also based on “intangibles” and phsyical attributes. We decided to investigate the speed, agility and strength of the top 750 prospects over each of the last 7 years using data collected from CBS sports . As expected, skill position players are fast, and lineman are strong. Just how strong and how fast? Check out the following graphs to find out.
NFL Draft 2011 – How to evaluate quarterbacks?
The NFL draft is upon us, and as usual, many teams are in desperate need of a franchise quarterback. Since the 2000 draft, 145 quarterbacks have been selected in the first 7 rounds, with 28 taken in the first round and an astounding 8 taken as the overall number one pick. This year, the talk has surrounded Gabbert, Newton and Mallett, and next year the consensus is Andrew Luck as the quarterback of the future. Based on intangibles, film and private workouts, some of these players will be pegged as the leader of their team, but how important is being drafted in the first round to overall success in the NFL? Using data collected from the Pro Football Reference and Draft History we look at where top performing quarterbacks are often selected.
Continue reading
College Football and Basketball Performance and Expenses
While Ohio State spends the most each year on their football program, they perform no better on the field than teams like USC, Texas and Florida who spend up to $10 million less. The team that spends the least per victory? Once again, Boise State leads the way.
In college basketball, the ACC coughs up the most money per year on their programs, but Memphis and Pittsburgh demonstrate the best victory/cost ratio. We investigated both big revenue sports programs and show which teams make the best use of their money, as based on winning percentage.
Continue reading
NCAA expenses and revenue across gender and sport
Take home message: Women’s sports lose money and only men’s basketball/football are profitable. As the great movie Starship Troopers probed: “Would you like to know more?”
Recently, there has been growing investigations into NCAA school impropriety in form of athlete payment, and while the amount of actual money changing hands might not be perfectly reported, we are continuing our own investigation on how much money college sports and their respective universities truly spend and generate. We compiled a list of 24 different sports across 135 colleges and universities that field at least one of the athletic activities. While this included many smaller schools that did not generate much revenue, the average amount of money spent per year by institutions is upwards of $30 million. While most of these schools investigated have an average of 15000 undergraduate students and assuming the money comes from their tuition, thats an approximately $2000 burden per student.
Continue reading
NCAA Div I College Football Expenses and Revenue
While football season is behind us, the amount of money generated by the NCAA and its schools remains of interest to us. Thanks to our friend Wesley Turner, we have acquired data on all NCAA Division I schools for total football revenue and expense. Much of the data can be further investigated at USA today’s website, and when available at Equity in athletics .
As would be expected, the big name football factories spend the most money on football related expenses, but the amount of profit that is generated on average per year is staggering. Over the 7 year period of 2003 till 2009, the top 10 schools (Texas, Georgia, Florida, Notre Dame, Michigan, Alabama, Penn State, LSU, Auburn and Ohio State) generated more than $30 million in profit per year. Texas which generates on average almost $50 million a year, has seen incredible sustained growth. In 2003, their profit margin was $34.6 million. In the year 2009? $68.8 million!
Continue reading
Upsets during March Madness
We have spent the last several days filling out our NCAA tournament brackets (as most of you probably have as well). This post looks at which teams have played competitively versus higher ranked foes, and which teams played poorly versus lower ranked opponents.
We investigated the number of times a given team has lost or won in an upset. Upsets were defined as whenever a lower seeded defeated a team with a higher seed. While it is very possible that a 1 seed might lose to a 2 seed, an 8 seed to a 9 seed, we took into account both the seed differential during the contest as well as the point differential. Compiling data from the past 5 years of tournament play, as well as using our handy Matlab tool kit, we came up with the following “biggest losers” and “biggest winners”.
Continue reading
NCAA Tournament Brackets
March Madness is upon us, and to get a taste for your brackets choices, play around with the following Java applet to see the historical win percentages for each round of play. A “NaN” indicates that that matchup has never happened before (i.e. a 16 seed winning the first round will create a “NaN” for the 3rd round winner). For complete data see the post on NCAA tournament seedings.

