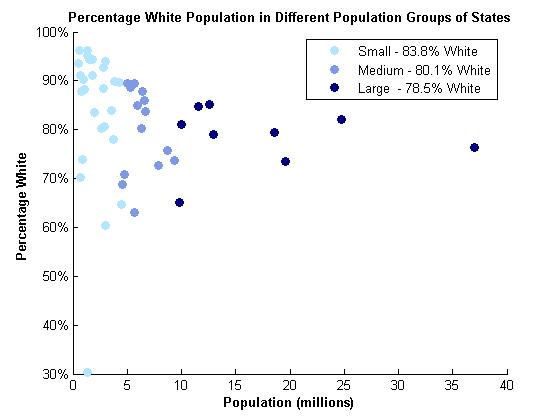
 Last week I demonstrated how the US Senate is unfair to voters in populous states. This week, I will examine how the Senate affects the political representation of racial minority groups. Looking at the map from last week, one can see that most of the least populous states are located in the Midwest, Mountain West, South and Northeast. What three out of four of these regions have in common is a large majority of European-Americans (a.k.a. “White people”). In fact, if you divide all of the states up into the same groups as last week, you will find that the least populous 26 states are 83.8% White, the medium population states are 80.1% White, and the nine largest states are 78.5% White. This distribution of the White population has the effect of marginalizing most minority groups by reducing their representation in the Senate.


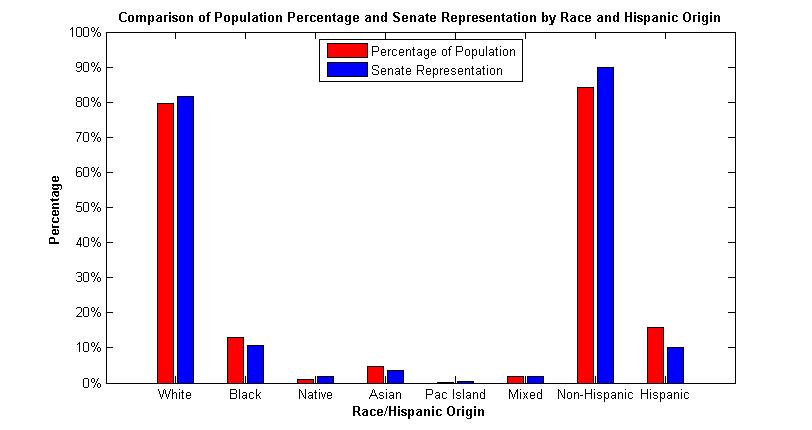
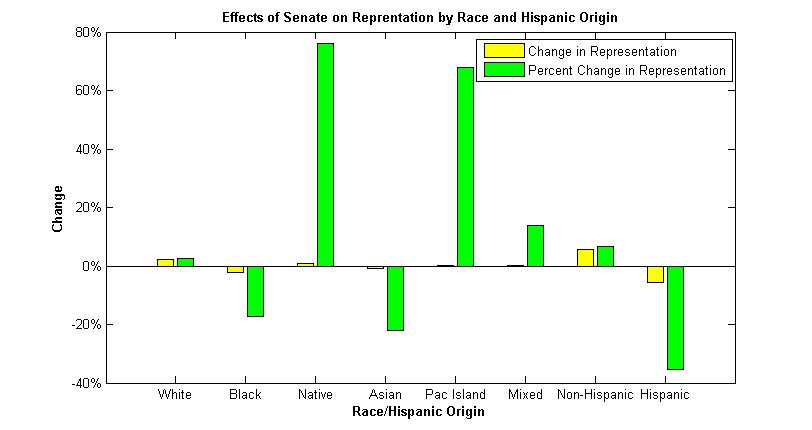
The second and third figures in this article show the effects of this uneven distribution on the representation of racial groups in the Senate. The second plot shows that the structure of the Senate changes the representation of every group of race and origin. Whites, Native Americans, Pacific Islanders, those of mixed race, and non-Hispanics are overrepresented because of the way states are represented in the Senate, while Blacks, Asians and Hispanics are underrepresented.
[table id=10 /]
I arrived at these numbers by adding up the percentage of each racial group in each state and dividing by the number of states. This treats each state in a population-neutral fashion, which is also what the Senate does. For instance, assume that a country has two states and a Senate. State A has 80% of the population, and State B has 20% of the population. Also assume that a minority group represents 40% of State A and 5% of State B. The “original representation” or percentage of the population of the minority group would be 37%, which is a weighted average of the minority population. The “Senate Representation” is the total representation of the minority group in terms of the sum of the constituencies of all the Senators and the total population of the country. In our example, the Senate Representation of the minority group would be 22.5%, the unweighted average of both states and a large drop from the actual representation in the population.
The second figure makes this problem seem trivial, as there are only a few percentage points of difference between “percentage of population” and “Senate representation”. However, the third figure shows that although the change in representation is small, the percentage change of the original representation can be quite large, especially in small minority groups. For instance, although blacks lose 2.23% of their representation because of the Senate, this is %17.35 of their original representation of 12.83%. Asians also suffer large losses, dropping 1.01%, or 22.05% of their original representation. Hispanics fare the worst out of all the minority groups, as they lose 35.5% of their representation because of the Senate. The groups with the largest percentage change of their original representations are Native Americans and Pacific Islanders, who nearly doubled their representation because of the Senate. Despite this change, these groups are still tiny minorities in the US. White people and non-Hispanics both gain small amounts of representation, but because they are already overwhelming majorities of the population, the percentage increases of their original representations are small.
Because of the skewed rules of Senate representation, racial minority groups are marginalized. This is proven by adding the number of minorities that each Senator “represents” as is shown above. However, not only does the lack of minorities in small states hurt minority representation, but the perpetual white majorities in most states limit minority representation even more. As Richard Rosenfeld wrote in his article “What democracy? The case for abolishing the United States Senate”, a white majority in almost every state “works a further discrimination against minorities, denying them the ability to elect ‘one of their own’ and thereby to have a voice in Senate debate.” The rigid borders of the states create de facto gerrymandered districts that almost all have White majorities and consequently almost never yield Senators from minority groups. In the 112th Senate, there are two Hispanics (Bob Menendez, D-NJ, and Marco Rubio, R-FL), one Japanese American (Daniel Inouye, D-HI) and one Native Hawaiian (Daniel Akaka, D-HI). Note that two of the four Senators from racial minority groups are from Hawaii, which is the only state without a White majority. This is truly a sad level of diversity in a chamber of government that holds the power to pass or reject any bill. This lack of representation of minority groups is a large barrier to social progress, racial fairness and justice.
Based on the unequal representation for minority groups, there is ample reason to eliminate or incapacitate the Senate and use only the House of Representatives to create laws. Minority groups are entitled to the same representation as the majority, and our laws should reflect this. Eliminating the Senate would help our country honor the most famous line of any US political document: “All men are created equal.”
Data for this post came from the US Census website: Estimated 2009 Population Data by Race and Hispanic Origin for Each State

I’ve been browsing online more than three hours nowadays, yet I never found any interesting article like yours. It is lovely worth sufficient for me. In my view, if all web owners and bloggers made good content material as you did, the net shall be a lot more useful than ever before.