The NCAA tournament is coming up in a few weeks with Selection Sunday just down the road. This means one thing… March Madness pools! Looking at historical data, the selection committee has done an excellent job in their seedings…

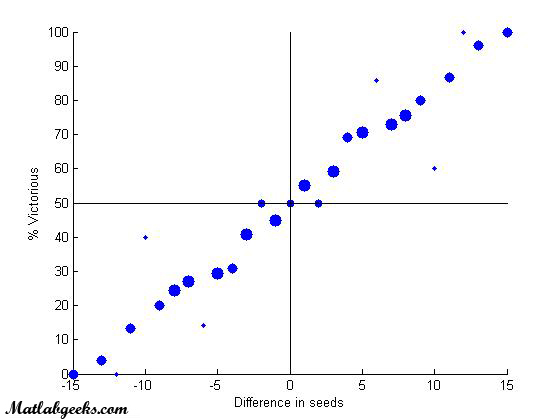
Based on correlation data of seeded team A playing seeded team B, the difference in seeds A-B explains 95.5% of the variance in winning! As the difference gets larger, fewer upsets are expected, and while upsets can still happen, they occur nowhere near the level that the media wants you to believe. The 5vs12?… They fall right in line with expectation. The dots on this graph represent a logarithmic scale for number of games played between teams with that particular seeding difference. Smaller dots = fewer games; larger dots = greater number of games.
Want some more data? Here you go:

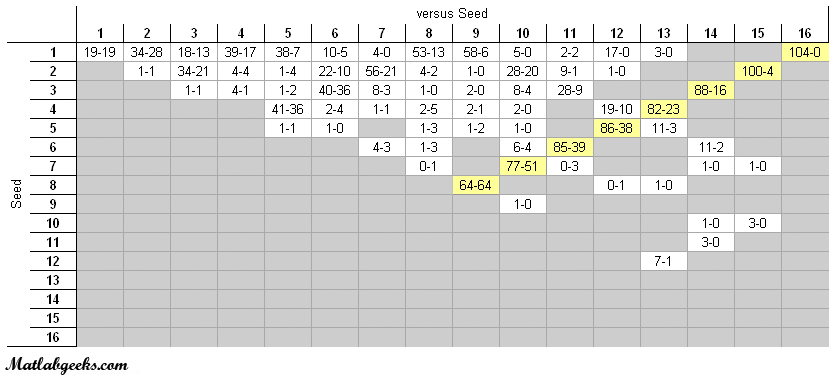
Data for this chart was obtained from mcubed.net. If reading across, it shows how a team fares versus all other seeds it has faced. For example, the number 1 seed has won all 104 of its meetings with a 16 seed. If a 1 seed plays a 1 seed (in the Final Four), both a win and a loss is accumulated by all 1 seeds historically, thus the equal number for 1vs1, 2vs2, etc. All the first round matchups are highlighted in yellow, though this year there will be 68 teams competing.
