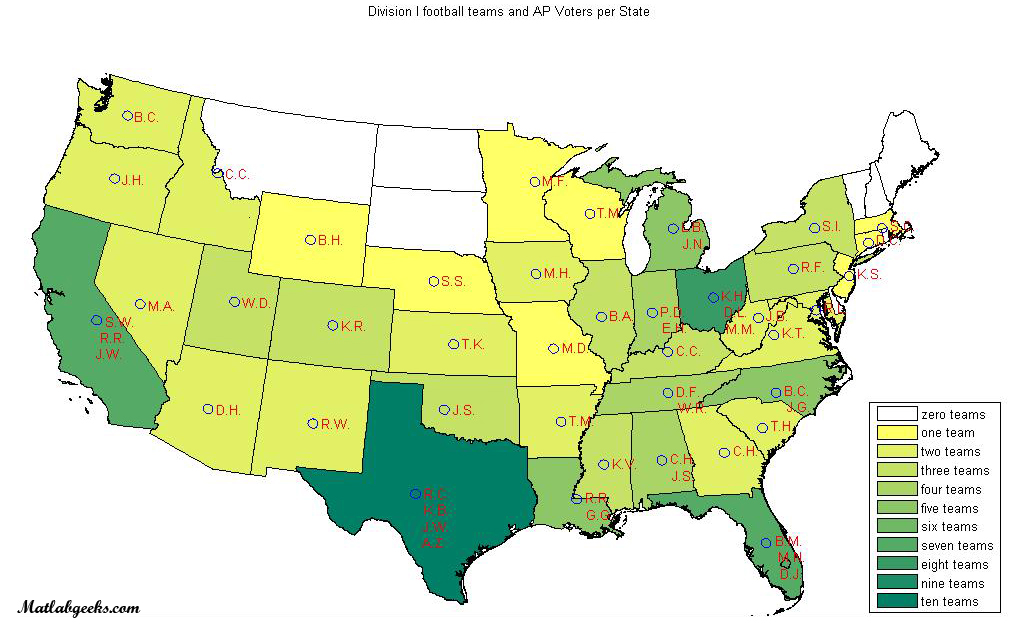
While Matlabgeeks previously analyzed team and conference rankings, this analysis of college football is of the out of conference records of all the major teams. Looks like some conferences tend to schedule easier teams in order to boost records, rankings and possible bowl bids and therefore money earned. We also utilize a wonderful toolbox called m_map to discuss AP voters and ability of Matlab to provide great maps for any analysis.
Matlab has some wonderful plotting tools, along with m_map that can allow you to create great plots such as this (if you have any future projects in mind let us know :). While I had a preconceived notion that there was an “east coast bias” among voters, it actually looks like the AP does a generally good job in the way they choose their voters. Breaking it down by the number of Div 1 schools through a color coded yellow to green and AP voters by initials and home state, we get the following.
Each state with a Division I (or FBS) team is represented by a voter, and those states that have a greater number of schools also have a greater number of voters. Now this isn’t to say that the voters are not biased, but at least the AP makes an effort to provide each team with equal representation. We also investigated the conference vs conference breakdown from 2000-2009. The data for this was provided by the great site: mcubed.net.
In order to interpret this data, choose a conference from the left and move across from left to right to see its record versus all other conferences. So for example, the ACC is 11-15 vs the Big 10 over the last 10 years (11 wins, 15 losses). Interestingly, while the majority of the BCS conferences fare respectively versus one another, much of the big name schools manhandle the smaller schools, as is seen by the Big 10’s 110-17 record vs the MAC, the Big 12’s 42-9 record vs the Conference USA and the SEC’s 75-4 record vs the Sun Belt. On a per year basis, these victories are adding anywhere from 5-10 free wins in the record for these conferences. This disparity only increases the amount of teams that can have winning seasons and continue playing and practicing into December.
While proponents of the BCS system claim that strength of schedule plays an important role in perception and rankings, it is only human nature to conclude that a team that finishes 6-6 is likely stronger than a team that finishes 5-7 and deserves a bid in a bowl. The same is true for any team that has +1 wins when compared to another team, whether its evaluating a team thats 10-2 versus one thats 9-3 and so on. This system just encourages teams in strong conferences to always play weak opponents to bolster their records and receive a payout. This is extremely true in many major conferences and teams who have “historically” been highly ranked.
Cherry picking some data from this year, the Oregon State Beavers played 9 conference games (PAC-10 ridiculously still enforces this, while other conferences only play 8), but also played versus highly ranked TCU, Boise State and Louisville. They finished 1-2 OOC and overall 5-7. They were left out of the postseason. Kentucky, on the other hand played 4 out of conference games versus Louisville, Western Kentucky, Akron and Charleston Southern. They finished 4-0 OOC, 6-6 overall and are receiving extra practices and a bowl game by playing in the Compass Bowl versus Pittsburgh.
A overhaul of the system might be necessary, or something that allows competitive balance among all teams without revenue being the driving factor. While this is difficult in a money-driven market, hopefully some change can occur.
Overall, this is just one of many fields in which Matlab can be utilized to analyze data. We’ll continue posting on different topics, but feel free to email us at support@matlabgeeks.com if you have anything in particular you would like to have investigated.


Very interesting article. I wonder though, how much bias there is in voting. For example: Do voters from Texas frequently rate UT, Texas A&M, or Texas Tech higher than the national average? I wonder if voters in the PAC10 region rank PAC10 teams higher than normal?
This is probably a bit harder to do. Pollspeak.com offers pretty good analysis and points out some of the worst pollsters, but I think the graphics matlab allows makes finding trends much easier to find.
Here’s pollspeak’s break down on the harris poll: http://www.pollspeak.com/pollstalker/pollstalker.php?r=F&s=13&p=33 for your reference.
Pingback: Pac-10 mailbag: A verdict on Neuheisel? | NowSportsLive
I’ve recently started a blog, the information you provide on this site has helped me tremendously. Thank you for all of your time & work.
I wish I sat next to you guys in high school!
Fight On! Go Pac-10 and the Big 12 (top to bottom – though Texas and Oklahoma have had well coached and talented teams) is always favored and over-over-over-rated!
I was surprised by the Big East (Which I use to call the Big Easy) owning the Big 12 AND SEC!!!
Pingback: College football 2000-2009: Conference Matchups and AP Voters … | 零度季节