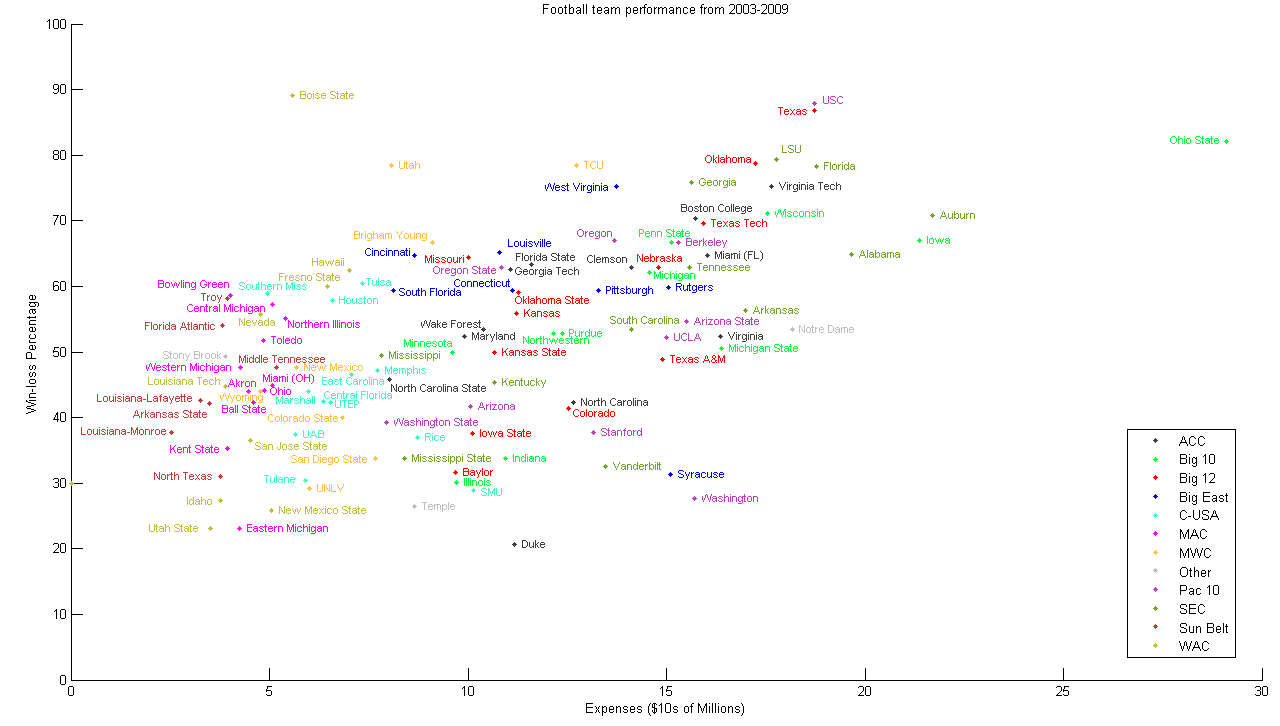
While Ohio State spends the most each year on their football program, they perform no better on the field than teams like USC, Texas and Florida who spend up to $10 million less. The team that spends the least per victory? Once again, Boise State leads the way.
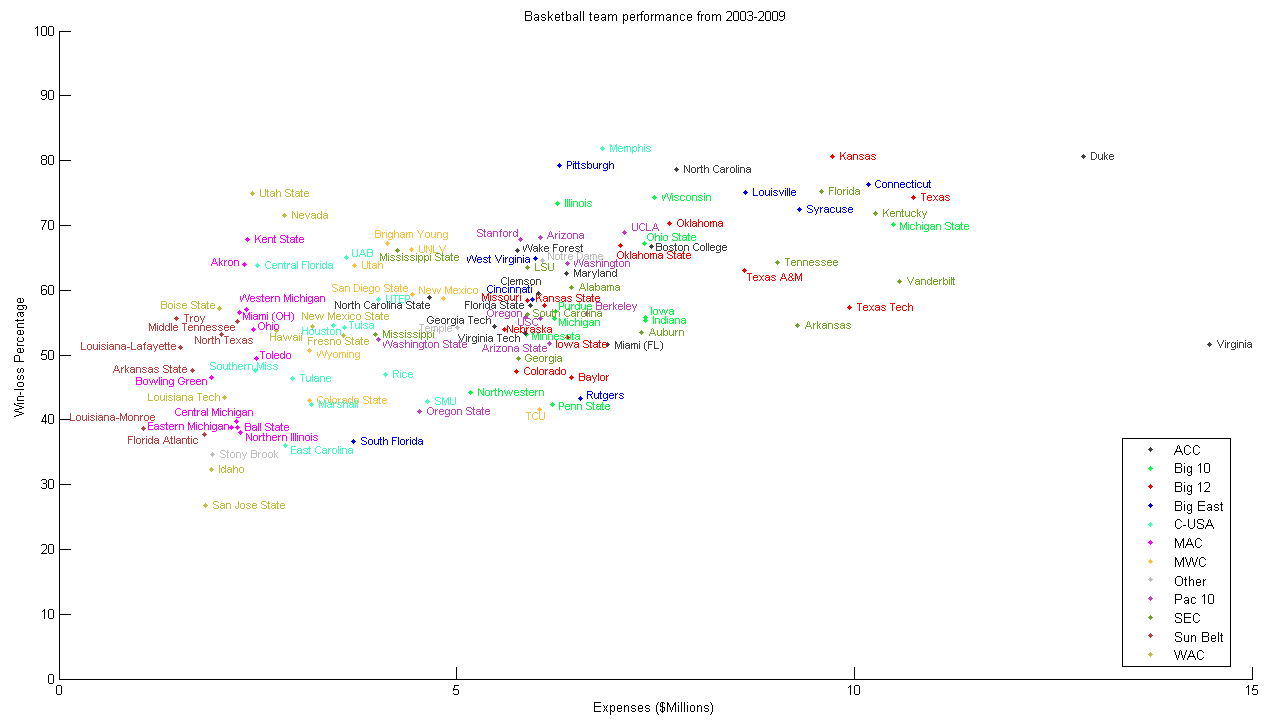
In college basketball, the ACC coughs up the most money per year on their programs, but Memphis and Pittsburgh demonstrate the best victory/cost ratio. We investigated both big revenue sports programs and show which teams make the best use of their money, as based on winning percentage.

As you can see, the big football factories are clustered towards the right, where they are spending lots of money each year to “purchase” victories. Often, schools will pay the lesser institutes to travel to their stadium as a non-conference foe and lose.
Interestingly the correlation between expense and winning percentage is r = 0.53. Spend more does mean win more and therefore increase future revenue.
While all teams that you see during March Madness are not represented in this figure, it still demonstrates how the big programs perform on a year to year basis. Additionally, the Conferences are just based on what you see in College Football (e.g. Notre Dame is actually in Big East for Basketball). Finally, the Virginia program shows up as the highest spending school, because according to the Equity in College Athletics website, the University spent almost $45 million on basketball in 2005.
The correlation between expense and basketball winning percentage is r = 0.55.

