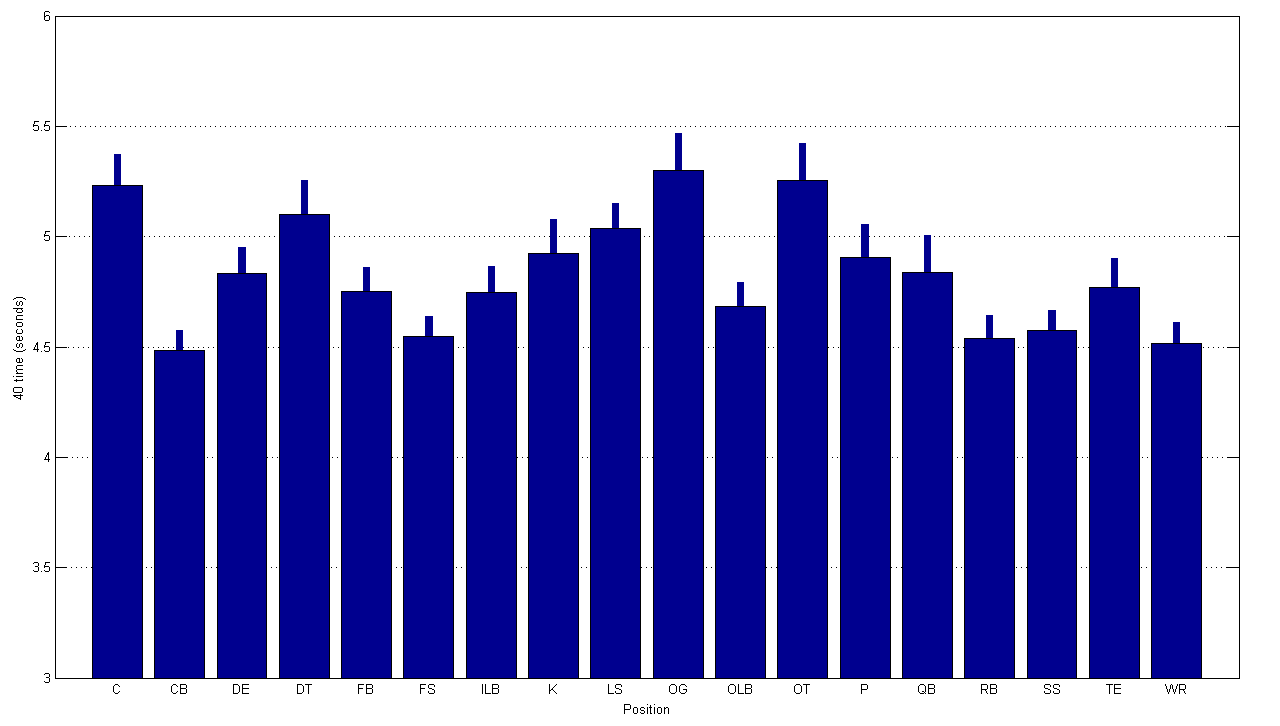
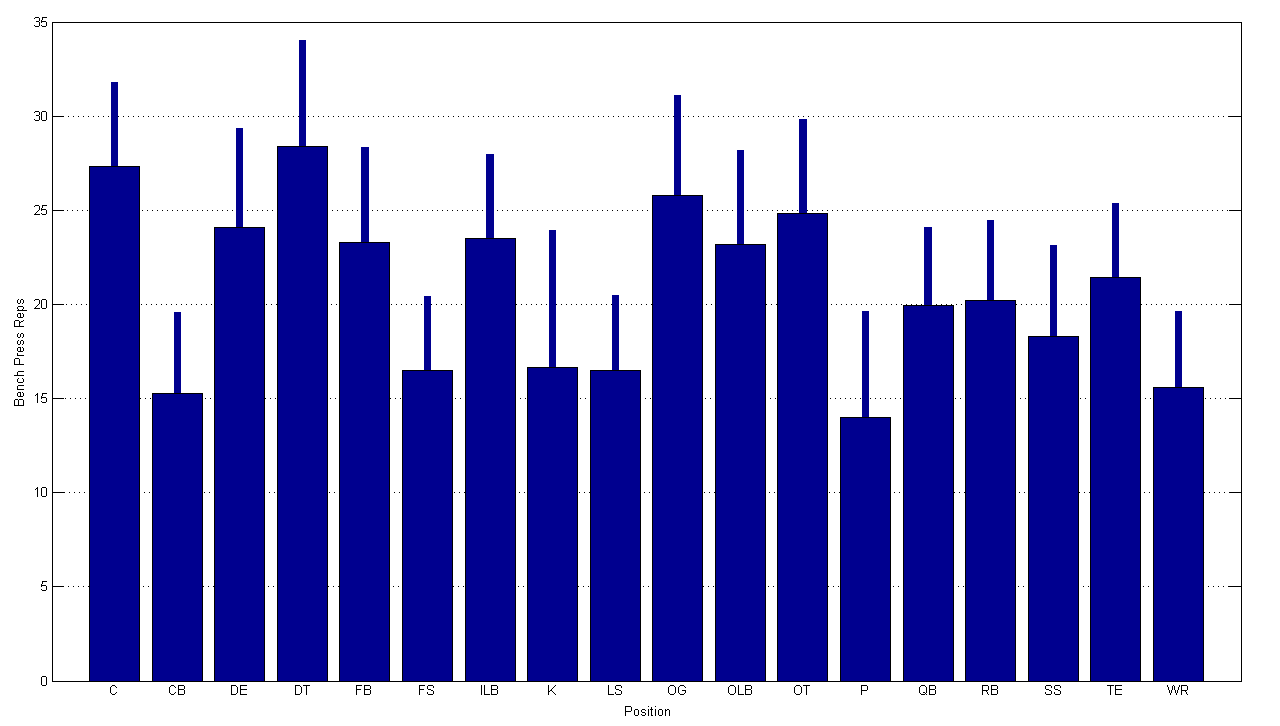
Each year a player’s stock rises tremendously due to performance at the combine (or based on Al Davis’ fancy). While much of a prospects’ mock draft ranking is based on past performance, much is also based on “intangibles” and phsyical attributes. We decided to investigate the speed, agility and strength of the top 750 prospects over each of the last 7 years using data collected from CBS sports . As expected, skill position players are fast, and lineman are strong. Just how strong and how fast? Check out the following graphs to find out.
Of course, not all players will run the 40 meter dash or attempt to bench press 225 pounds, therefore those who do probably are some of the faster and stronger at their position, but nonetheless we can see how each position stacks up. (Additionally, we have plotted both the average and one standard deviation using Matlab’s “bar” command).
For those curious, LS stands for long snapper, the others are explained in the table below. Also, kickers and punters are quite strong and fast…
Interestingly, we found no relationship between either pre-draft ranking and 40 times or bench press strength, when looking at all positions together. Similarly, weak correlations are seen on a position by position basis (r ~ 0.2 for all positions). This definitely shows that teams are more interested in college performance and talent than they are with the combine numbers. We didn’t investigate things like the Wonderlic, but rather just physical examinations. But with with very weak correlations, why exactly are players put through these tests, and what do the teams use the data for? It’s possibly an indicator of injury or some deficit, but otherwise, they just test an individual mental ability to withstand a few weeks of examination.
As for the rest of the player data and tests run at the combine, including the vertical jump, broad jump, shuttle and cone drills, here are the average (standard deviations) for each of the 18 positions. The table is sortable and lists only the first 10 positions; additional positions can be seen by clicking the (>) button.
Take away note… lineman are huge :). Otherwise, hopefully this can allow you to see where the next elite prospect falls in terms of averages. While there doesn’t seem to be much variance within each position, other skills that translate onto the playing field obviously vary based on a player’s role on the field. Note: The (*) was a single individual.
[table id=11 /]


