Last week we looked at the usage of guide in building a GUI. We included radio buttons, both editable and static text boxes, a drop-down menu and a push button. This week, we’ll create our second GUI to display a table (uitable). As all the decisions in blackjack hinge on two pieces of information: 1) the face up card of the dealer; and 2) the player cards, a look-up table can provide an optimal method for making a simple informed choice of whether to hit, stand, split or double down.
Start by opening another new blank GUI through guide and inserting a table component. Your workspace might look something like this:
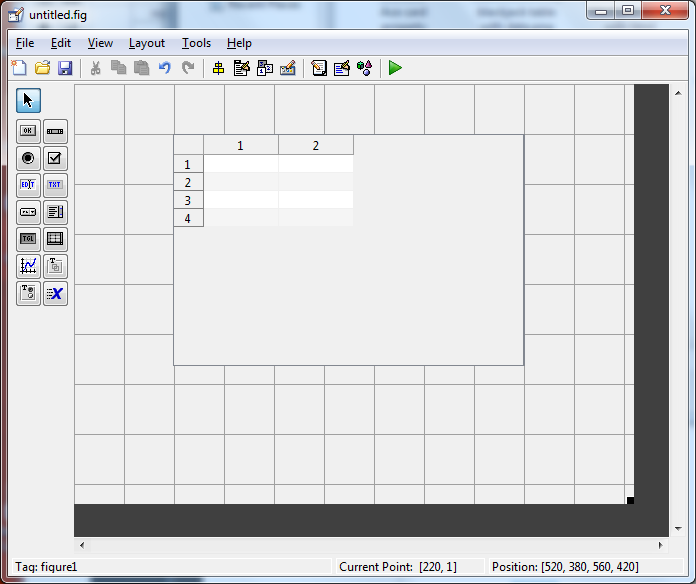
By default, a table will be created with 4 rows and 2 columns. If additional rows or columns are needed, as will be the case here, right-click on the table and select “Table Property Editor…”.
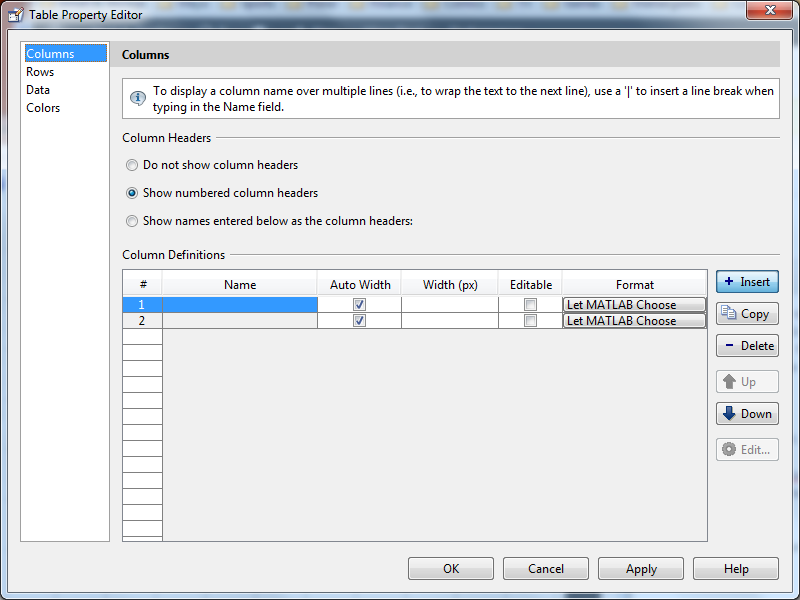
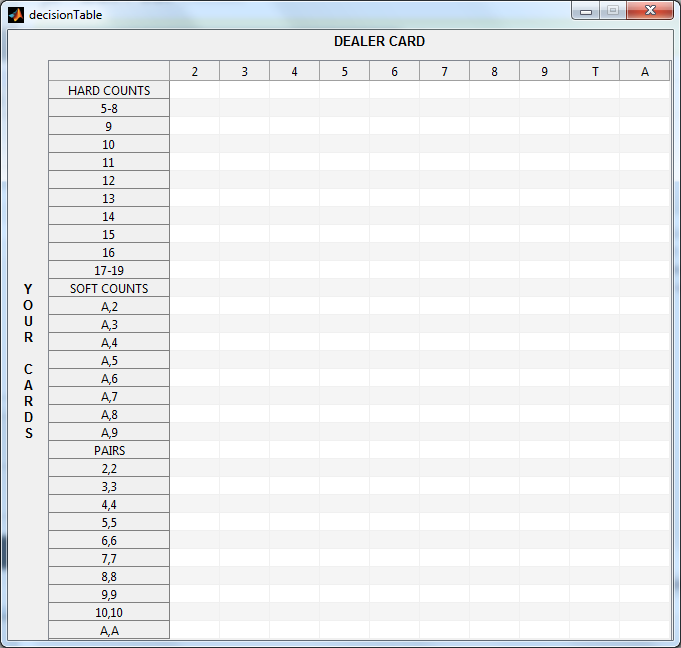
At this point create 10 columns with the names ‘2’,’3′,…’A’ for the dealer cards and create 31 rows with the different card combinations that a player might hold. This will include 10 combinations of hard counts (Sum values of 5-19), 8 combinations of soft counts (A+2, A+3,…A+9), and 10 combinations of pairs (2+2, 3+3,… A+A). Additionally, to add labels to the columns and rows, we’ll insert some static text components to identify the dealer cards and the player’s cards. Unfortunately, for static text (uicontrol), it is impossible to rotate text, and we decided to create 9 different static text values with a different letter assigned to each one to create the label “Your Cards”. If you want to do a rotation, the command text has a rotation property that can come in handy as well. The final product will look as follows:
Again, upon saving the figure, guide will automatically create an m-file for this table. You can similarly create the same table through code, without the use of guide, with the following commands. Note that you might want to modify the uitable and figure properties to fit your needs. The code for creating the table is as follows:
>> f = figure('Position',[50 50 665 610]);
>> colNames = {'2','3','4','5','6','7','8','9','T','A'};
>> rowNames = {'HARD COUNTS',...
    '5-8','9','10','11','12','13','14','15','16','17-19',...
    'SOFT COUNTS',...
    'A,2','A,3','A,4','A,5','A,6','A,7','A,8','A,9',...
    'PAIRS',...
    '2,2','3,3','4,4','5,5','6,6','7,7','8,8,','9,9','10,10','A,A'};
>> t = uitable('Parent',f,'ColumnName',colNames,'RowName',rowNames,...
    'ColumnWidth',{50},'Position',[45 -20 650 600]);
So now we have a functional table, but it is so far empty. If data is to be pre-set, this can be accomplished through the uitable command using the ‘data’ option, or through guide in the “Table Property Editor…”. As we intend to utilize the drop-down menu in our main GUI to select which type of strategy to employ, we require several different tables, depending on the user’s choice. Therefore, we will create a function that generates these strategies based on the dealer’s face card and the player’s cards. To start, our two strategies will be: 1) basic strategy and 2) a randomly generated strategy of hit, stand, split or double down. By creating a 31×10 cell array of the basic strategy, saved in the array ‘data’, we can create the following table now:
>> set(t,'data',data);
Unfortunately, the data by default is left justified, with all cells in using the same font color. What would be more easily legible would be a matrix that shows each decision choice in a different color. To do so, we will have to utilize html code. First, find the values in the cell array of a certain value. Use the same syntax for the ‘H’,’S’ and ‘D’ cells:
>> pIndex = find(ismember(data,'P'));
Then utilize the command strcat to append the following html code for changing the cells font coloring and cell alignment:
>> data(pIndex) = strcat('<html><div style="width:35px" align="center"><span style="color: #0000FF; font-weight: bold;">', ...
   data(pIndex), '</span></div></html>');
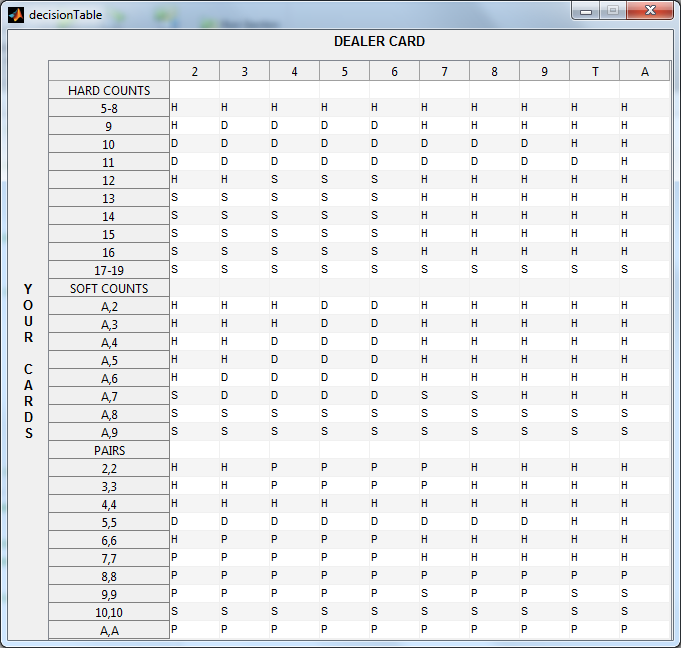
Update the table data and we should end up with the following final product:
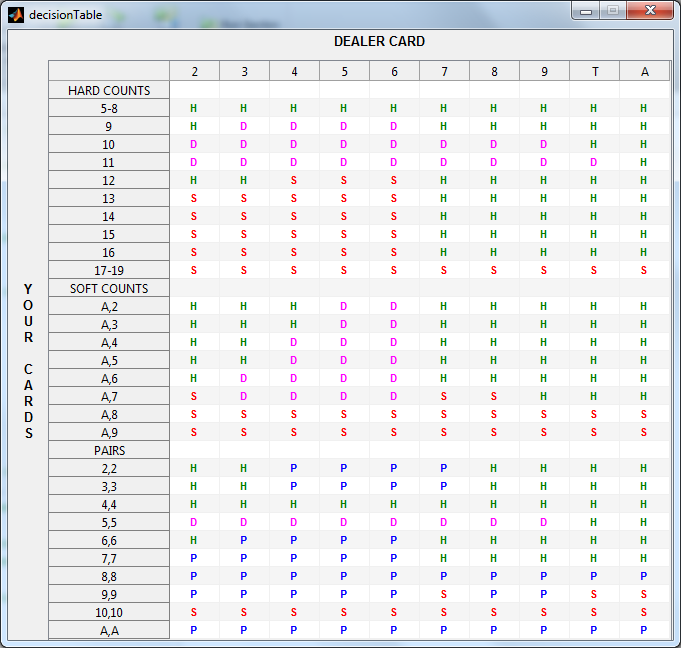
And we’re done! A much easier to read table is now complete. We’ve also attached the blackjackTables.m code for the creation of the blackjack tables to this post. Feel free to play around with it and create your own blackjack strategy cards. Otherwise, next week we’ll combine Parts I and II and get some more user inputs through the GUI, including the drop-down menu selections for these tables we’ve created, as well as the radio buttons and text boxes we created last week.
If you have any suggestions or comments, please don’t hesitate to contact us in the comment fields below.
shitty and offensive
It was dark when I woke. This is a ray of suiennhs.
thanks.
how to show more than one number in one cell of table in guide of MATLAB
Hi,
I wanted to align row names left in the same way you did data, however it did not work. Do you know how to do it?
Colomnwidth = 50 and style=”width:35px”, why not the same values?
People on forums say there is no working roulette system, you can’t
beat it in the long run, but i’m using bluehand roulette system for
weeks and it earns me decent money everyday, maybe couple of weeks is not a long run, maybe i’m lucky