After you create a plot in Matlab, you might need to modify the characteristics of the figure. While many options can be specified during the initial plot command, they can easily be modified later as well using plot handles, and the useful functions of ‘findobj’,’get’ and ‘set’. If you are unclear on some of these commands, or need a refreshers, take a look at our tutorial on plotting .
If any modifications are needed for a figure, you can run a get command on the current figure to obtain its properties: handle = get(gcf). By saving the values to the variable handle, the figure properties can be easily modified through a set command: set(handle,’PropertyName’,’value’).
All figure properties can be found at Mathworks
Sometimes you want to specify exactly what part of the figure to modify. This is where the findobj command is extremely useful. By default, the findobj command will just return all the graphical objects present. So if you run:
figure;
figure;
findobj('Type','figure')
Matlab will return:
ans =
2
1
Indicating the two figures (1 and 2). Findobj without any arguments will also return a ‘0’ indicating the root of the object tree.
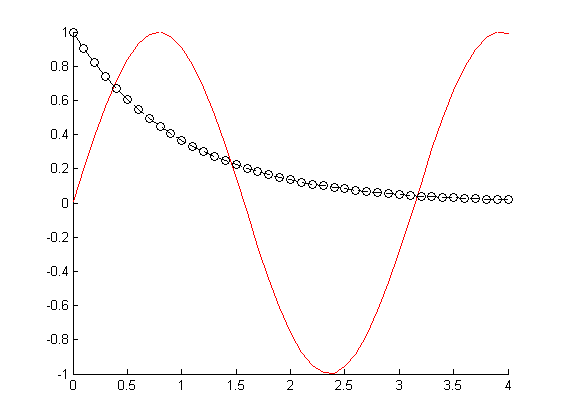
Let’s see how we can use findobj to modify previously created figures. As an example, lets plot two lines, one a decaying exponential, and a sinusoidal. This can be done initializing two functions F1 and F2, and a sample time interval.
t = 0:0.1:4;  F1 = sin(2*t);  F2 = exp(-t);
figure; hold on;
plot(t,F1,'r');
plot(t,F2,'ko--');
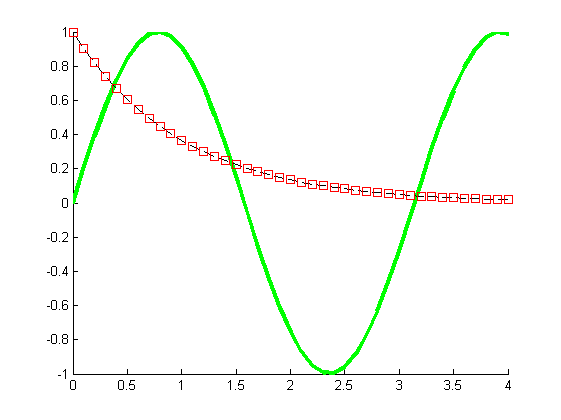
What if you want to change the color and linewidth of the sinusoidal curve?
We could do a search for all lines:
handle = findobj(gcf,'Type','Line')
Unfortunately, this will return two values, for the two lines created. (Note: Your numbers will vary)
handle =
175.0027
174.0027
Therefore, we can specify the red sinusoidal line as follows:
handle = findobj(gcf,'Type','Line','Color','red')
This will return a single handle value, as we require. Many other figure properties can be used to specify this line. Play around with it till you get the right one for your plot. Logical operators such as ‘and’,’or’,’not’ can also be used:
handle = findobj(gcf,'Type','Line','-not','Color','black')
handle =
174.0027
And now we can modify the line using the set command:
set(handle,'Color','Green','LineWidth',3);
And change the markers of the exponential so that they are red squares?
handle = findobj(gcf,'Marker','o')
set(handle,'Marker','s','MarkerEdgeColor','red');
To see all the modifiable properties, simply run ‘get(handle)’ and see what else you are able to change. Other findobj choices that will come in handy include searching for certain strings as described on Mathworks. Leave a comment or discuss further on our forums if you have further questions or ideas.


that was more helpfull than MATLAB documentation 🙂
This was clear and helpful.