College Football and Basketball Performance and Expenses

While Ohio State spends the most each year on their football program, they perform no better on the field than teams like USC, Texas and Florida who spend up to $10 million less. The team that spends the least per victory? Once again, Boise State leads the way.

In college basketball, the ACC coughs up the most money per year on their programs, but Memphis and Pittsburgh demonstrate the best victory/cost ratio. We investigated both big revenue sports programs and show which teams make the best use of their money, as based on winning percentage.
Continue reading

Upsets during March Madness

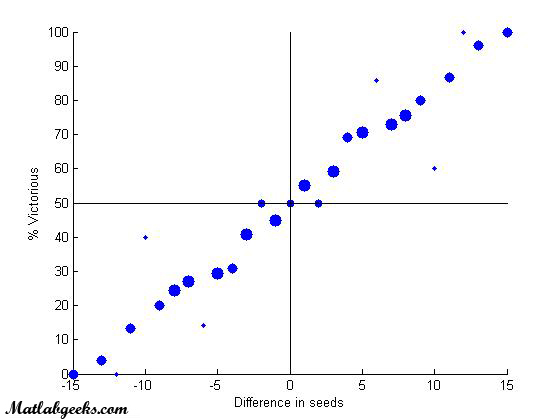
We have spent the last several days filling out our NCAA tournament brackets (as most of you probably have as well). This post looks at which teams have played competitively versus higher ranked foes, and which teams played poorly versus lower ranked opponents.

We investigated the number of times a given team has lost or won in an upset. Upsets were defined as whenever a lower seeded defeated a team with a higher seed. While it is very possible that a 1 seed might lose to a 2 seed, an 8 seed to a 9 seed, we took into account both the seed differential during the contest as well as the point differential. Compiling data from the past 5 years of tournament play, as well as using our handy Matlab tool kit, we came up with the following “biggest losers” and “biggest winners”.
Continue reading

NCAA Tournament Brackets

March Madness is upon us, and to get a taste for your brackets choices, play around with the following Java applet to see the historical win percentages for each round of play. A “NaN” indicates that that matchup has never happened before (i.e. a 16 seed winning the first round will create a “NaN” for the 3rd round winner). For complete data see the post on NCAA tournament seedings.


<br /> No Java 2 SDK, Standard Edition v 1.4.1 support for APPLET!!<br />