College Football and Basketball Performance and Expenses

While Ohio State spends the most each year on their football program, they perform no better on the field than teams like USC, Texas and Florida who spend up to $10 million less. The team that spends the least per victory? Once again, Boise State leads the way.

In college basketball, the ACC coughs up the most money per year on their programs, but Memphis and Pittsburgh demonstrate the best victory/cost ratio. We investigated both big revenue sports programs and show which teams make the best use of their money, as based on winning percentage.
Continue reading

NCAA expenses and revenue across gender and sport

Take home message: Women’s sports lose money and only men’s basketball/football are profitable. As the great movie Starship Troopers probed: “Would you like to know more?”

Recently, there has been growing investigations into NCAA school impropriety in form of athlete payment, and while the amount of actual money changing hands might not be perfectly reported, we are continuing our own investigation on how much money college sports and their respective universities truly spend and generate. We compiled a list of 24 different sports across 135 colleges and universities that field at least one of the athletic activities. While this included many smaller schools that did not generate much revenue, the average amount of money spent per year by institutions is upwards of $30 million. While most of these schools investigated have an average of 15000 undergraduate students and assuming the money comes from their tuition, thats an approximately $2000 burden per student.
Continue reading

NCAA Div I College Football Expenses and Revenue

While football season is behind us, the amount of money generated by the NCAA and its schools remains of interest to us. Thanks to our friend Wesley Turner, we have acquired data on all NCAA Division I schools for total football revenue and expense. Much of the data can be further investigated at USA today’s website, and when available at Equity in athletics .

As would be expected, the big name football factories spend the most money on football related expenses, but the amount of profit that is generated on average per year is staggering. Over the 7 year period of 2003 till 2009, the top 10 schools (Texas, Georgia, Florida, Notre Dame, Michigan, Alabama, Penn State, LSU, Auburn and Ohio State) generated more than $30 million in profit per year. Texas which generates on average almost $50 million a year, has seen incredible sustained growth. In 2003, their profit margin was $34.6 million. In the year 2009? $68.8 million!
Continue reading

Upsets during March Madness

We have spent the last several days filling out our NCAA tournament brackets (as most of you probably have as well). This post looks at which teams have played competitively versus higher ranked foes, and which teams played poorly versus lower ranked opponents.

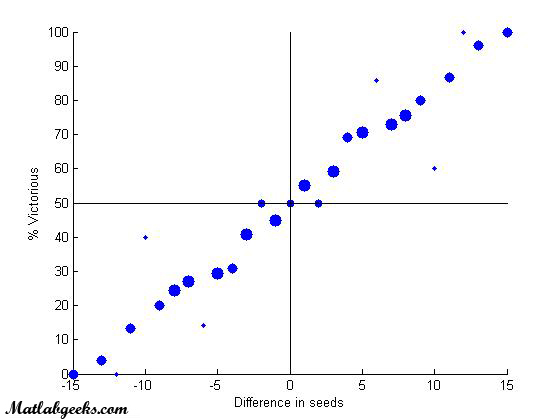
We investigated the number of times a given team has lost or won in an upset. Upsets were defined as whenever a lower seeded defeated a team with a higher seed. While it is very possible that a 1 seed might lose to a 2 seed, an 8 seed to a 9 seed, we took into account both the seed differential during the contest as well as the point differential. Compiling data from the past 5 years of tournament play, as well as using our handy Matlab tool kit, we came up with the following “biggest losers” and “biggest winners”.
Continue reading

NCAA Tournament Brackets

March Madness is upon us, and to get a taste for your brackets choices, play around with the following Java applet to see the historical win percentages for each round of play. A “NaN” indicates that that matchup has never happened before (i.e. a 16 seed winning the first round will create a “NaN” for the 3rd round winner). For complete data see the post on NCAA tournament seedings.


<br /> No Java 2 SDK, Standard Edition v 1.4.1 support for APPLET!!<br />

2010 College Football Rankings

At Matlab Geeks we crunched through all 15 weeks of AP voting and tabulated how college football teams were ranked throughout this season. Non-surprisingly, the automatic BCS qualifying conferences had the most number of teams ranked throughout the year, with a great portion of them coming from the Big 10 and SEC. We also looked at our version of “strength of schedule”. We investigated each Division 1 team and looked at their week by week opponent and how many votes that opponent received the week they played and also during the final week of voting. Oregon State ended up having the toughest schedule, while several teams played the entire year without playing a single team that received any votes, much less any ranked teams. Read on for some pretty graphs/charts and some Matlab tips for how to perform the analysis.
Continue reading

College football 2000-2009: Conference Matchups and AP Voters

While Matlabgeeks previously analyzed team and conference rankings, this analysis of college football is of the out of conference records of all the major teams. Looks like some conferences tend to schedule easier teams in order to boost records, rankings and possible bowl bids and therefore money earned. We also utilize a wonderful toolbox called m_map to discuss AP voters and ability of Matlab to provide great maps for any analysis.
Continue reading