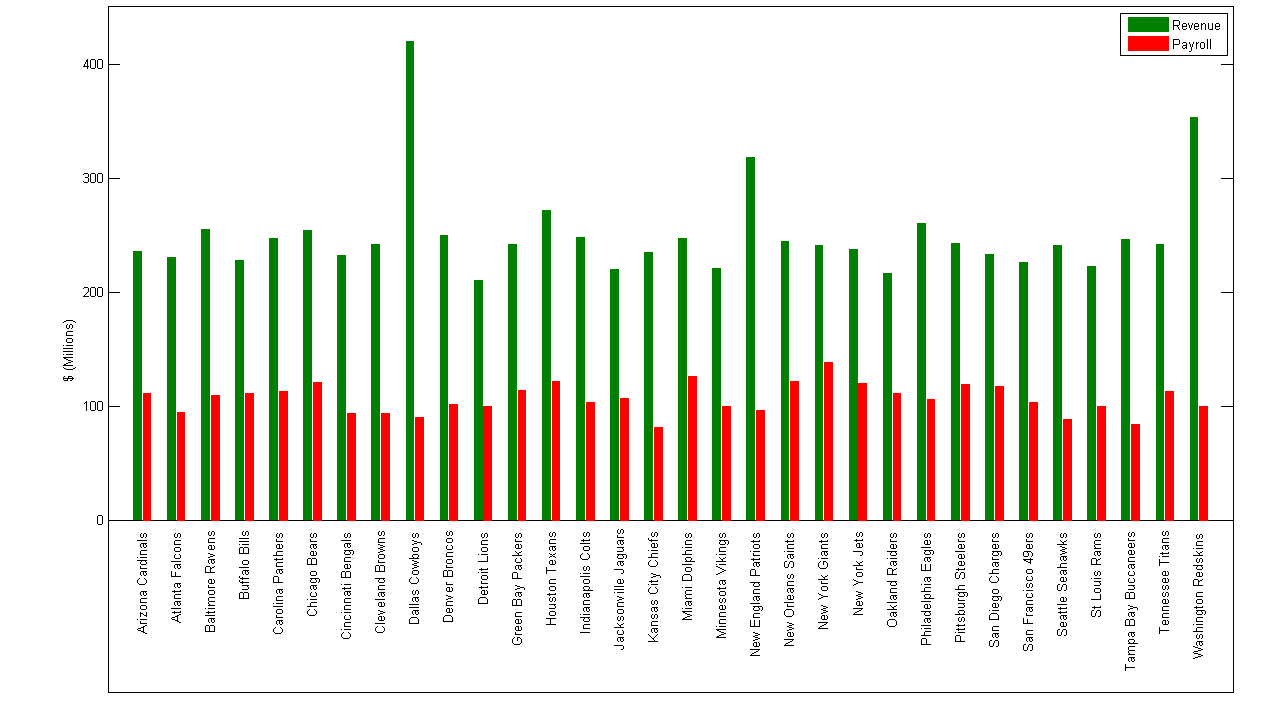
While the NFL just finished its 2011 draft this weekend, it once again is in a lockout, with the owners and players fighting over revenue, season length, health care and other issues. The actual numbers for each of the teams are hard to come by, but thanks to Forbes, we wanted to see what kind of money is being fought over by the 32 owners (as a confession, I am a little biased towards the players).

Continue reading
Tag Archives: football
NFL draft – running the 40 and bench pressing
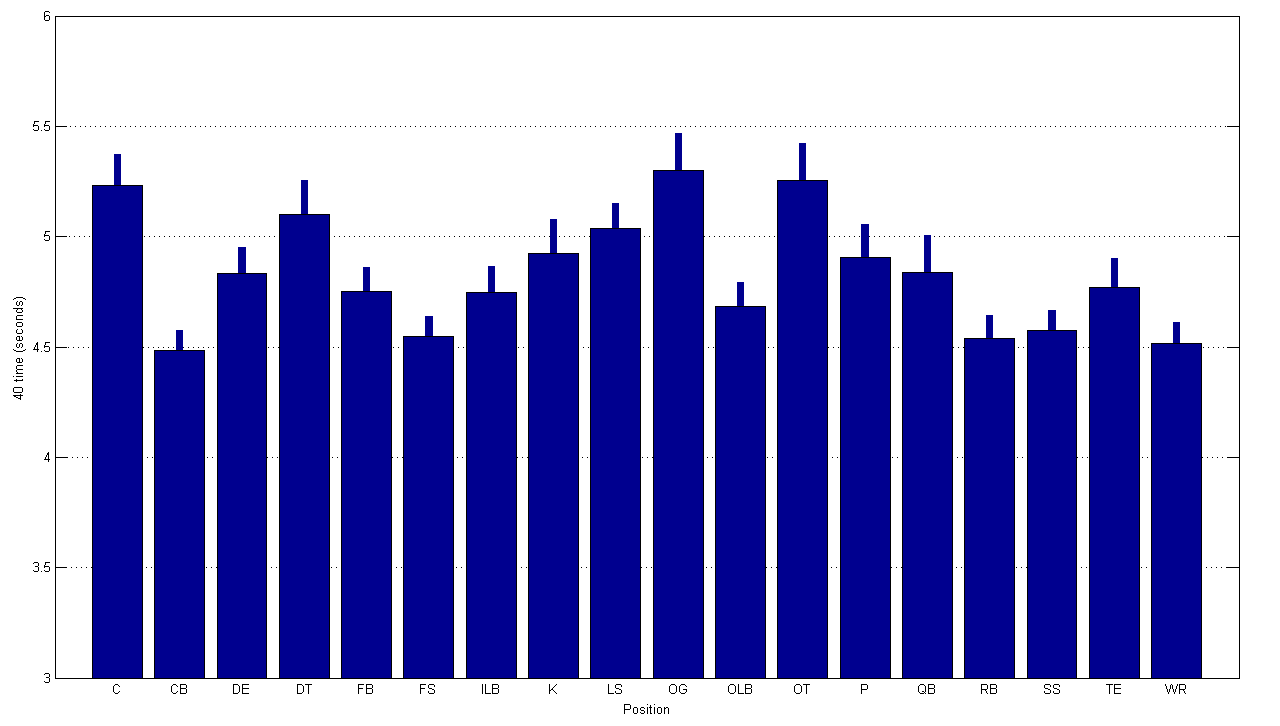
Each year a player’s stock rises tremendously due to performance at the combine (or based on Al Davis’ fancy). While much of a prospects’ mock draft ranking is based on past performance, much is also based on “intangibles” and phsyical attributes. We decided to investigate the speed, agility and strength of the top 750 prospects over each of the last 7 years using data collected from CBS sports . As expected, skill position players are fast, and lineman are strong. Just how strong and how fast? Check out the following graphs to find out.
NCAA Div I College Football Expenses and Revenue
While football season is behind us, the amount of money generated by the NCAA and its schools remains of interest to us. Thanks to our friend Wesley Turner, we have acquired data on all NCAA Division I schools for total football revenue and expense. Much of the data can be further investigated at USA today’s website, and when available at Equity in athletics .
As would be expected, the big name football factories spend the most money on football related expenses, but the amount of profit that is generated on average per year is staggering. Over the 7 year period of 2003 till 2009, the top 10 schools (Texas, Georgia, Florida, Notre Dame, Michigan, Alabama, Penn State, LSU, Auburn and Ohio State) generated more than $30 million in profit per year. Texas which generates on average almost $50 million a year, has seen incredible sustained growth. In 2003, their profit margin was $34.6 million. In the year 2009? $68.8 million!
Continue reading
2010 College Football Rankings
At Matlab Geeks we crunched through all 15 weeks of AP voting and tabulated how college football teams were ranked throughout this season. Non-surprisingly, the automatic BCS qualifying conferences had the most number of teams ranked throughout the year, with a great portion of them coming from the Big 10 and SEC. We also looked at our version of “strength of schedule”. We investigated each Division 1 team and looked at their week by week opponent and how many votes that opponent received the week they played and also during the final week of voting. Oregon State ended up having the toughest schedule, while several teams played the entire year without playing a single team that received any votes, much less any ranked teams. Read on for some pretty graphs/charts and some Matlab tips for how to perform the analysis.
Continue reading

